
Corporate observability / Enterprise product design
Toyota DEPOTOne platform.
The whole picture.
Connecting fragmented reporting into a single, role-aware observability experience.
Explore the case study01 / The challenge
The data existed.
The picture didn’t.
Toyota’s corporate observability reporting was spread across several databases and roughly 20 applications. Users had to visit different tools, pull individual reports, and compile the information before they could understand what was happening across departments.
The work was time consuming because the user had to become the integration layer. My task was to design a new application from scratch that brought those reporting experiences together—not simply a directory of links to the old tools.
- My responsibility
- Sole designer: user research, persona-based testing, information architecture, interaction and visual design, light/dark modes, and developer handoff.
- Collaboration
- Working directly with the development team in an Agile environment.
- Product scope
- Single-entry portal, executive reporting, volumetrics, costs, platform usage, pipeline health, and self-service.
~20 → 1
fragmented reporting applications, one experience
Role-aware
a front door tailored to different user needs
2 themes
light and dark designs for every screen
02 / The approach
Start with the question.
Not the source application.
I conducted user research and testing with different personas to understand their pain points when compiling information across applications. The organizing question was what each person needed to understand or accomplish—not which legacy tool owned the data.
That distinction shaped the architecture. A user looking for a departmental overview needs a different starting point from someone investigating platform usage or tracking an onboarding request. One platform should support those differences without recreating the fragmentation.
Understand the whole picture
An overview-first path supports cross-department reporting. Summaries establish context before the user moves into a detailed view.
Investigate a specific signal
Focused paths into volume, cost, storage, queries, and pipeline health retain the detail needed to explain an overall trend.
Complete a service task
Self-service paths make onboarding and request status part of the same ecosystem, while keeping them distinct from analytical work.
The design principle
One connected system. Different paths to relevance.
The portal establishes the destination. Shared navigation and reporting patterns make the sections feel connected. Progressive detail keeps the overview useful without sacrificing the information specialists need.
03 / The design
A front door.
A clear route into the data.
- 01Enter through DEPOT
- 02Get an overview
- 03Investigate the detail
- 04Take the next action
Decision 01 / Entry & orientation
The same front door.
Not the same journey.
I designed the single point of entry to direct different users and roles toward the sections relevant to their use case. The portal gives each destination a recognizable place rather than asking users to remember which separate application they need.
The supplied portal groups observability, self-service, and knowledge resources alongside company content. That separation makes analytical work and service tasks discoverable without flattening them into one undifferentiated menu.
The balance: one place to begin, with distinct paths for different intentions.
Decision 02 / Overview & consistency
Make the overview readable.
Keep the structure familiar.
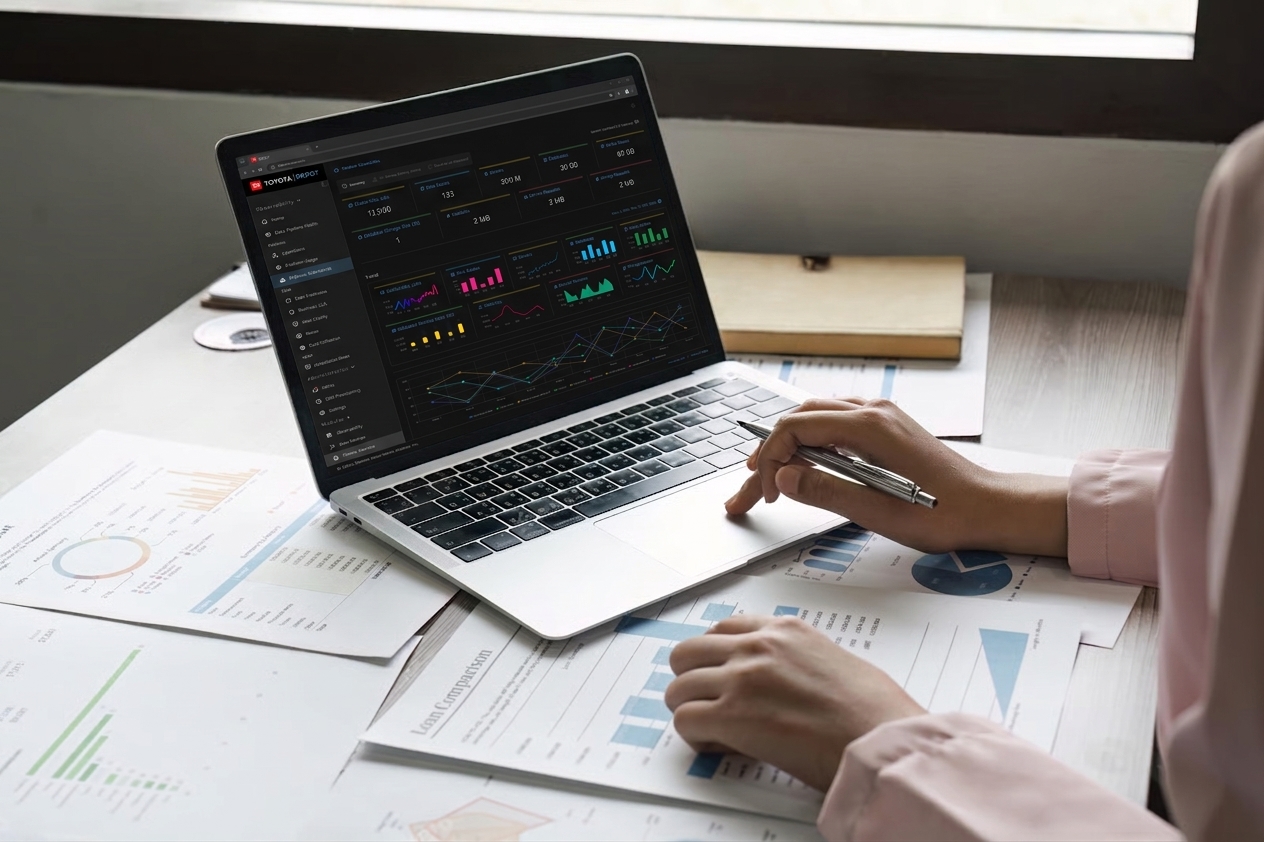
The executive dashboard brings headline measures, trends, and departmental comparisons into one view. I used a summary-first hierarchy so users can orient themselves before inspecting the richer charts and breakdowns below.
I designed light and dark versions of every screen. The two executive dashboard designs demonstrate the approach: the information, layout, and relationships remain stable while the surfaces change. Color supports the reading of data, rather than becoming the only way to understand it.
Decision 03 / Progressive detail
From a signal
to the records behind it.
A dashboard answers “what is happening?” but a specialist also needs to ask “where is it coming from?” The three volumetrics levels show a deliberate progression: summary trends, source-level comparison, then granular records.
This keeps the first view scannable without making detailed information a dead end. Common navigation, aligned columns, and repeated chart patterns carry context between levels rather than forcing users back into a separate reporting application.
Decision 04 / Connected reporting
Different questions.
A shared visual language.
Cost utilization, storage, and query analytics each answer a different question. I connected them through a consistent hierarchy of headline measures, visual comparisons, trends, and detailed records. The goal was to reduce the effort of interpreting another section—not merely the effort of opening it.
Keep investigation
close to the evidence.
Pipeline health brings summaries, records, and activity feedback together. Keeping them on the same surface helps users relate a high-level signal to its operational context instead of compiling another report to explain it.
Decision 05 / Self-service
Not just seeing the platform.
Working within it.
DEPOT also includes self-service workflows. The pod onboarding review consolidates the request before submission, while the user onboarding list makes request status visible. These designs connect reporting and service work within one product without treating them as the same task.
04 / Validation & delivery
Validate with people.
Deliver with engineering.
I conducted user research and user testing across different personas to understand the pain points of assembling data from multiple applications. That work informed the role-aware entry model and the reporting experience, keeping the design grounded in the needs of the people compiling and interpreting the information.
As the sole designer in an Agile environment, I worked with the development team to ensure a clean handoff. The design scope included both themes for every screen, so engineering had a coherent direction across the platform—not isolated dashboard concepts.
Persona-based research
Understand the different reporting questions, starting points, and pain points before organizing the new platform.
User testing
Evaluate the experience with different personas rather than assuming one dashboard serves every workflow equally well.
Clean Agile handoff
Collaborate with developers to communicate the intended structure and the light/dark designs consistently across screens.
05 / The outcome
Less assembling reports.
More seeing the picture.
The designs brought corporate observability into one place, giving users a clear overview across the spectrum of departments and reducing time spent compiling individual reports from multiple applications.
My contribution connected research, a from-scratch product architecture, detailed reporting and self-service screens, dual-theme design, testing, and development handoff. The result was a unified experience with enough depth to support specialist use cases.
The starting point of roughly 20 applications is approximate. Time savings are described qualitatively; no verified percentage, task-time study, or adoption figures are provided here.
- One point of entry tailored to different roles and use cases
- A connected view across departmental reporting
- Less time compiling reports from separate applications
- Summary-to-detail paths for specialist investigation
- Consistent light and dark designs across the platform
What I took forward
“One application is not the same thing as one experience. The connections have to be designed.”
DEPOT taught me that consolidation is an information architecture problem before it is a visual one. Putting twenty tools behind one login is easy; making them feel like one product means designing the paths between them—shared patterns, predictable drill-downs, and entry points shaped by role. On every platform project since, I map the questions each persona brings before I map the data, and I treat consistency across sections as a feature, not a style guide afterthought.